Screen crypto pairs in real time
Track and screen cryptos using conditions of indicators, its filters and timeframes and get back a ranked list of every crypto pair that matches. Build your own multi-condition scans and keep them.
If any of these sound familiar
We built CryptoScreenerApp because screening the whole market from a phone took more work than it should.
What traders keep saying.
I open it, tap RSI, tap oversold, tap 4 hour and I have a list. That used to be twenty minutes of flicking between charts before I'd even started thinking.
Stacking RSI under 35 with relative volume above two and price over the 200 EMA, all in one scan, is exactly the combination I was rebuilding by hand every morning. Now it has a name and it's there when I wake up.
I never formally learned half these indicators. 'Squeeze, coiled' and 'Buyers in control' told me what I was looking at without me having to go and read what the Choppiness Index is.
Lost signal on the train and it said so and offered a retry, instead of showing me numbers from ten minutes ago. That's a small thing that matters a lot.
The 3 and 5 minute screens come back quick enough to be worth running mid-session. Going back to a timeframe I'd already used was basically instant.
The CSV includes the conditions and the timestamp. A list of tickers on its own is useless a week later. This one I can actually go back to.
No email, no wallet, no KYC screen before I can look at anything. Installed it and was screening in under a minute.
Every screen is in Marathi, not just the menu. I have not seen another screener do that at all.
Everything you need to screen the market.
Four taps take you from opening the app to a ranked list, and a search box skips two of them.
Screen by an indicators you trade with
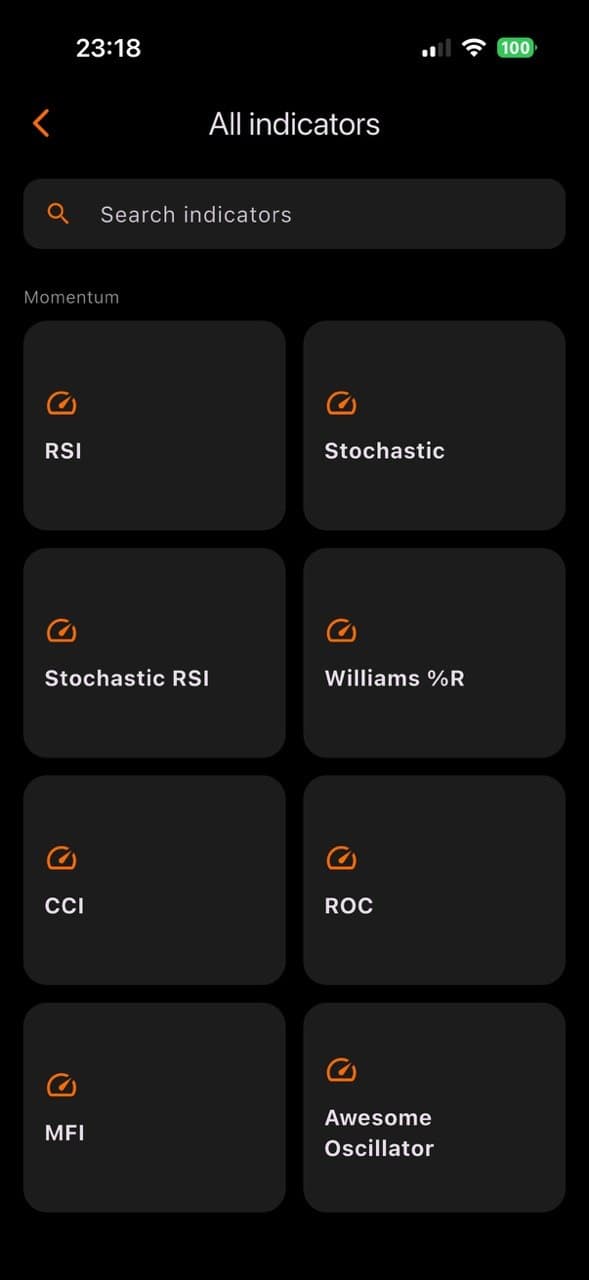
RSI, MACD, EMA and SMA at 5, 20, 50 and 200, VWAP, Bollinger Bands, ADX, SuperTrend, Parabolic SAR, Ichimoku, Stochastic, Stochastic RSI, Williams %R, CCI, ROC, Money Flow Index, Awesome Oscillator, Aroon, ATR, Choppiness, Donchian, TTM Squeeze, Relative Volume, OBV, Chaikin Money Flow and more.
- Grouped by categories: Momentum, Trend, Volatility, Volume, Fundamentals
- Search by what you want. Type “oversold”, “breakout” or “squeeze”
Filter easily
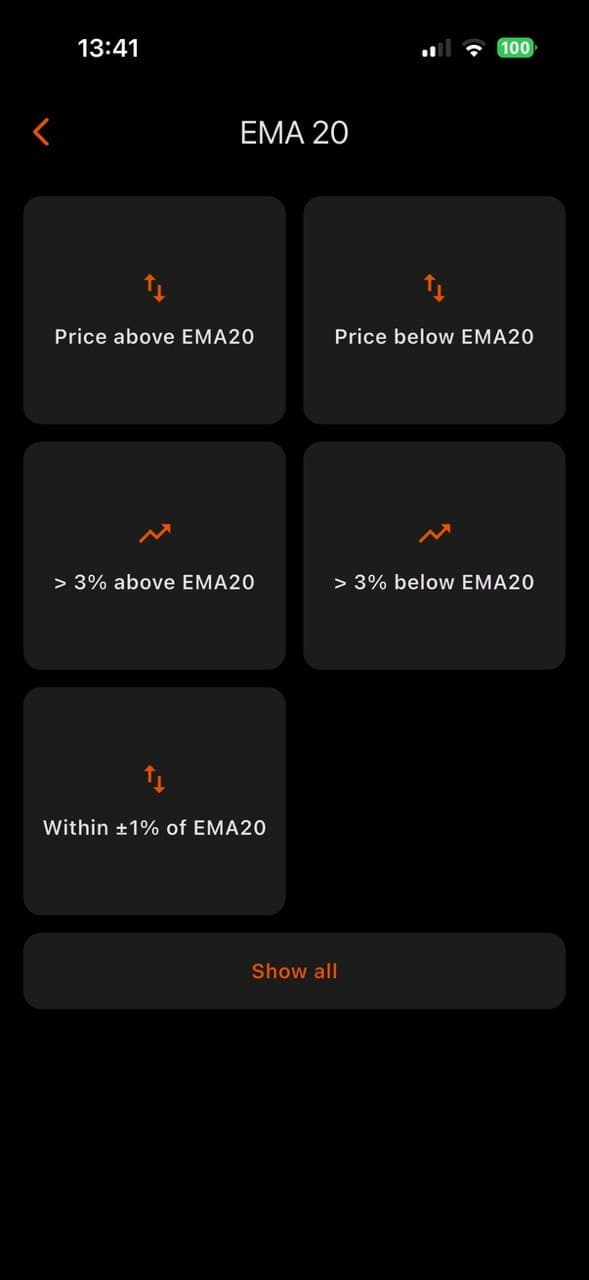
Every indicator opens on a grid of ready conditions. We write them the way you would say them out loud, so you can use an indicator you never formally learned. Tap one and the market comes back sorted.
- Over 220 one-tap conditions across the indicator set
- “Oversold”, “Golden-cross regime”, “Volume spike”, “Squeeze, coiled”
- Or tap “Show all” and see every coin ranked by the reading itself
Screen on the candle you actually trade
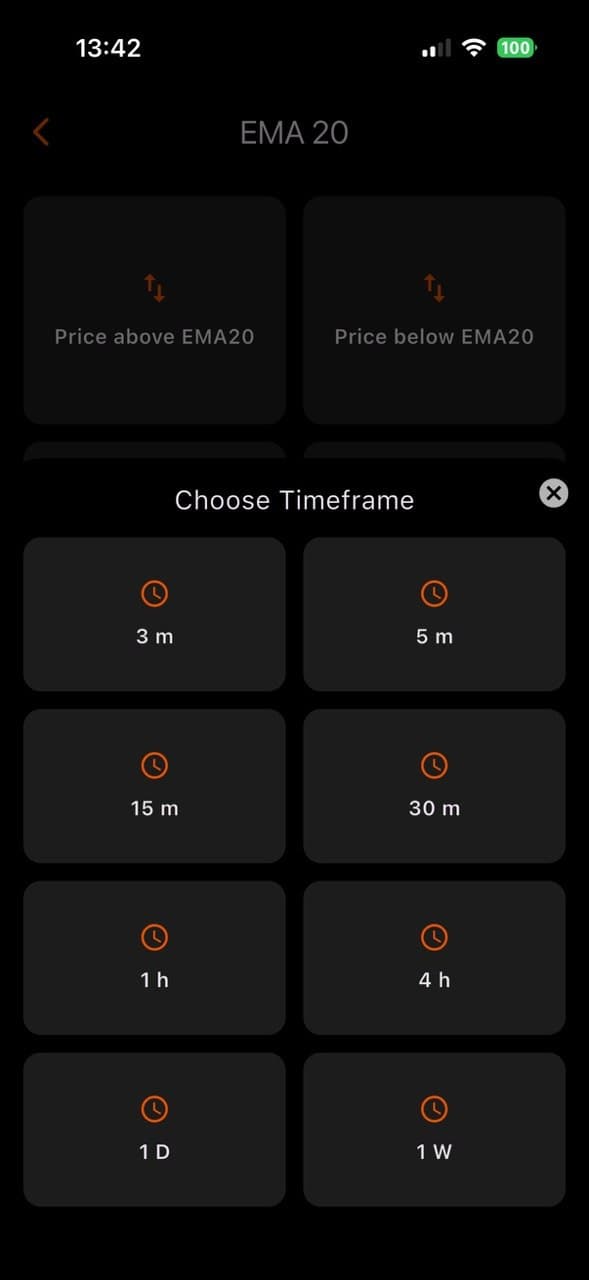
Three minutes, five, fifteen, thirty, one hour, four hours, daily, weekly. The screener recalculates against whichever one you pick, from scalping through to positional.
- 3m, 5m, 15m, 30m, 1h, 4h, 1D, 1W
- Any single condition inside a custom scan can carry its own timeframe
Every match comes back ranked
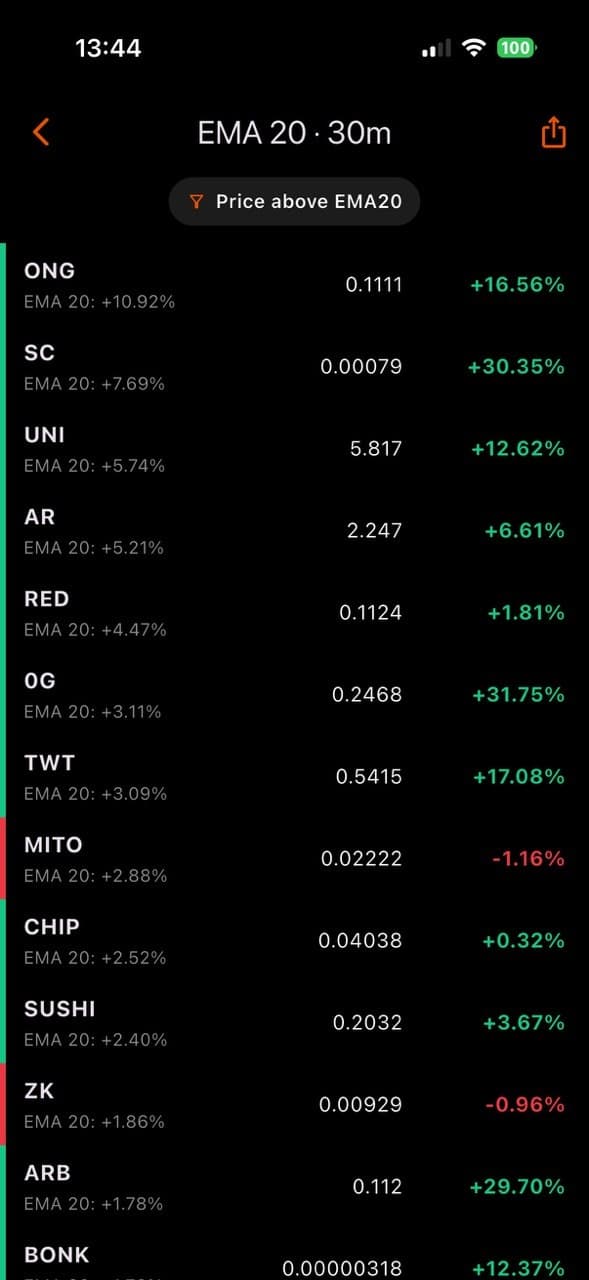
Coins matching to the scan comes according to search by either the strongest or weakest first depending on your scan type. Each row shows price, the day’s move and the indicator’s own number.
- Row colour follows the 24-hour move, so the list reads green or red at a glance
- Tap a column to reorder by ticker, price or the day’s move
- Tap refresh to re-run the same scan against the market as it is now
Build and save your own custom screeners
A ready-made screener cannot give you this, and it is why people stop rebuilding the same filter combination every morning.
Build your own scan
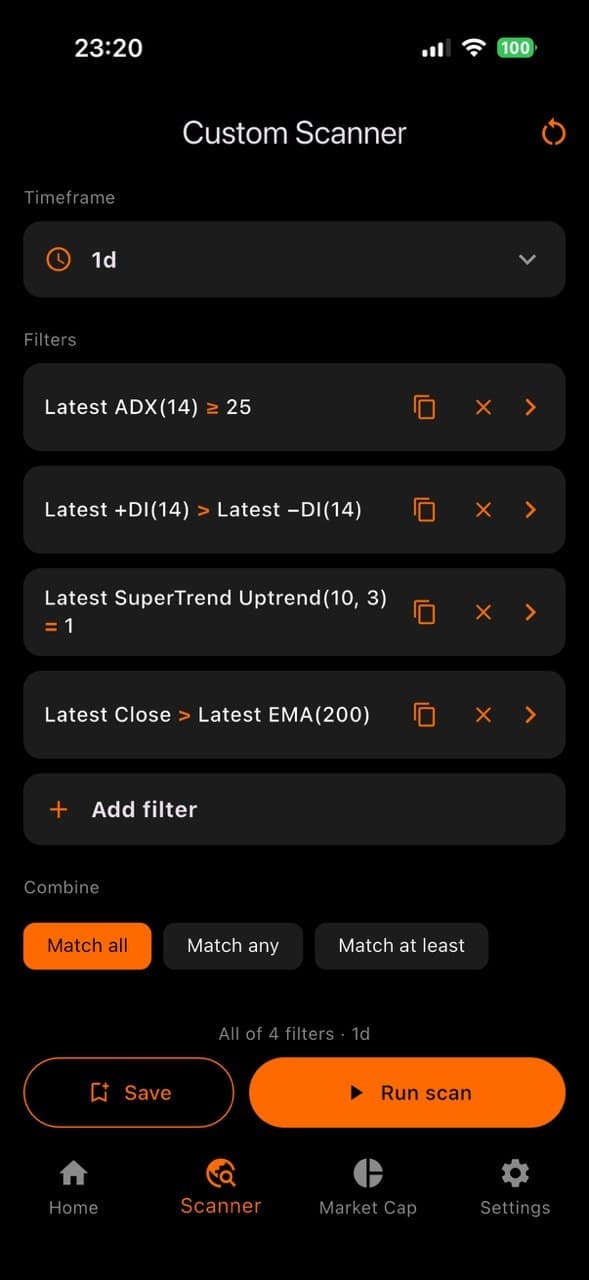
Choose what to measure, choose the condition, type the number. Stack as many conditions as you want across Price, Moving averages, Momentum, Trend, Volatility, Volume, 24h market data and Fundamentals.
Screen exactly how you want
Decide how the conditions combine: a coin must match all of them, any of them, or at least a number you set. One scan, however strict or loose you want it.
Compare to the minute type
Compare one indicator against another rather than against a number. Catch the exact pairs which have an indicator line crossing above or below another.
Fully customizable
A 21 EMA instead of 20, a 50/200 regime instead of the default, a Bollinger multiplier that suits how you trade. You control the periods and multipliers on every condition.
Keep the scans you like
Name a scan and save it on device. No need for manually making the screener time or everyday, save once and done.
Every indicator you can screen by.
Forty-five indicator screeners, each ranking 1000+ crypto pairs. Seven fundamentals boards sit alongside them, covering the top 500 coins by market cap.
More than a list of indicators.
The boards, exports and shortcuts that make it something you open every morning.
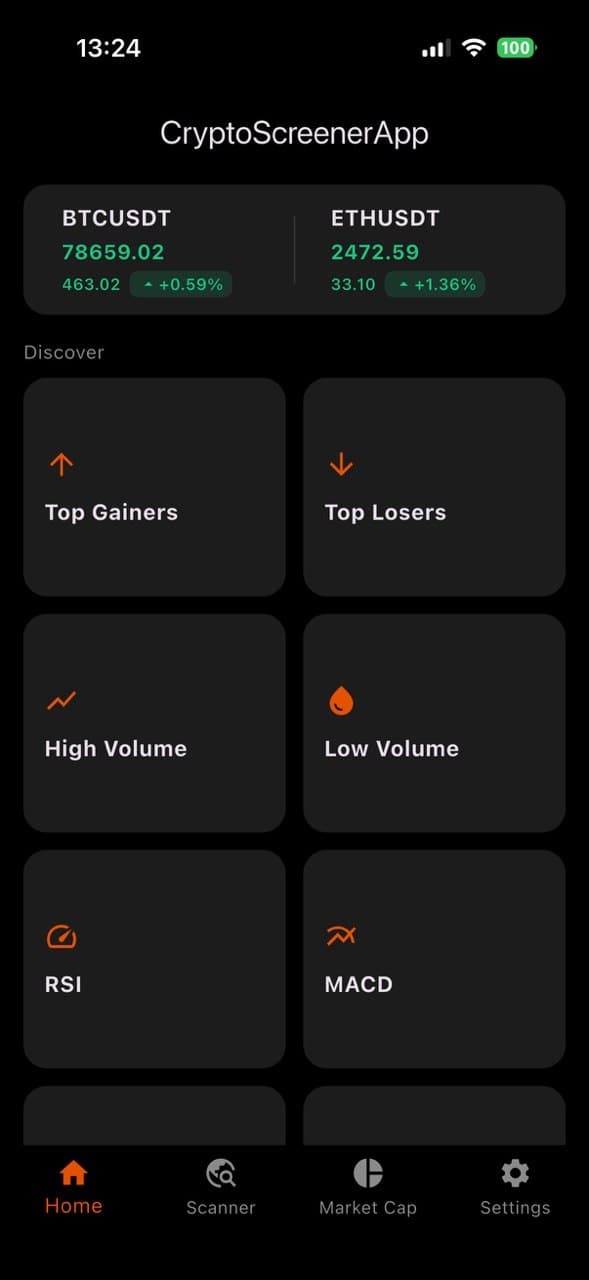
Today’s movers
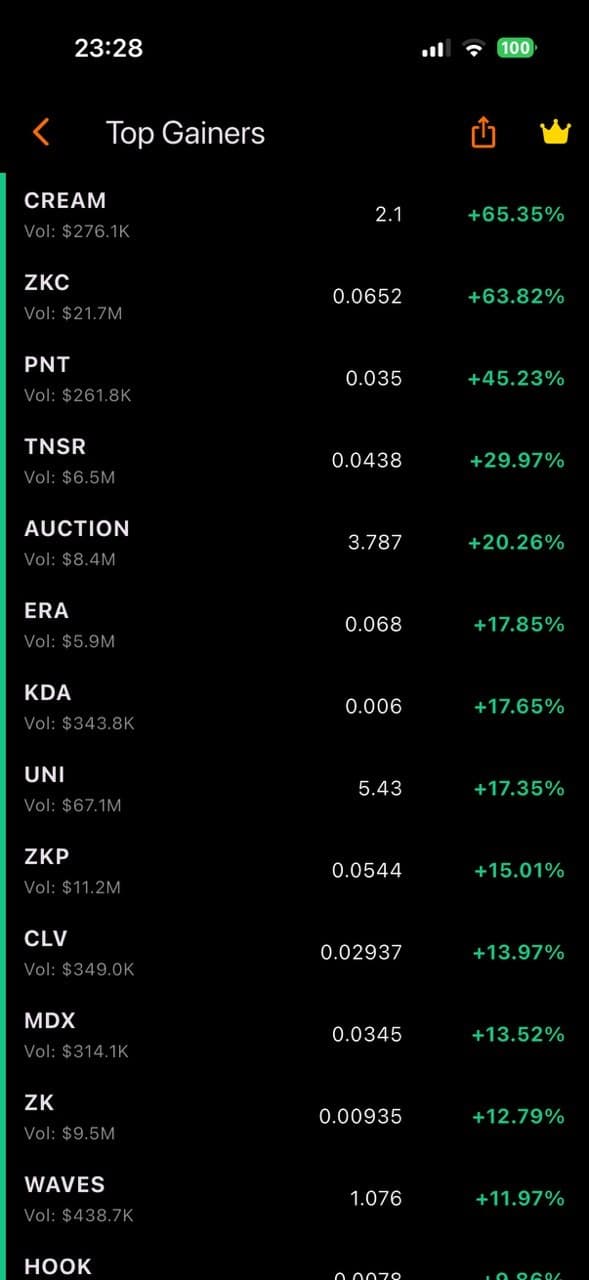
Top Gainers, Top Losers, High Volume and Low Volume, each ranked across the whole USDT market. Illiquid pairs are kept out so you don't get stuck.
Live BTC and ETH
Streaming Bitcoin and Ethereum prices sit at the top of the home screen, with the day’s change in both dollars and percent, green or red on each tick.
Market-cap leaderboard
Every ranked coin, with Bitcoin dominance, total market value and the 24-hour move across the top. That gives you the context to read any single coin.
Fundamentals boards
Volume against market cap, dilution, circulating supply, distance from all-time high, 7-day move and beta. Seven boards covering the top 500 cryptocurrencies.
Nine ready strategies
Oversold reversal, Band breakout, Squeeze about to fire, Strong uptrend, Golden-cross regime, Volume spike, Overbought fade, Trend pullback, Liquid large caps etc.
Take results with you
Share the ranked list as a message, export a spreadsheet for Sheets, Excel or Numbers, or copy just the tickers. Every export carries the conditions and the time you ran it.
Search by intent
Type what you are after rather than the name of the tool. Search runs across indicator names and their descriptions, so “breakout” finds the right screen.
Ready before you are
While you answer three setup questions, the app already loads the timeframes that match how you trade. Your first screen is a screener, not a loading bar.
Nothing to sign up for
No account, no email, no wallet connection, no ads. The app reads public market data and cannot touch funds, place orders or reach an exchange account.
What it does, and what it won’t.
The things worth knowing before you install rather than after. The right-hand column is deliberate: some of it is missing because we left it out.
What it does
- Says so when the data is stale
If the connection drops, the screen tells you and offers a retry. It will not hand you ten-minute-old numbers dressed up as the live market.
- Talks in plain words, not formulas
Conditions read “Oversold” and “Buyers in control”, so you can screen by an indicator you never formally studied.
- Keeps your saved scans on the device
Scans you name are written to your phone and never uploaded.
What it will never do
- No calls
You get what each indicator reads right now, ranked. No buy calls, no price targets, no predictions, no auto-trading. The trade stays your decision.
- Never touch your money
No wallet to connect, no exchange keys required.
- No identification
No account, no email, no KYC. Download the app and start screening crypto pairs.
Questions about CryptoScreenerApp.
Not financial advice
CryptoScreenerApp shows you what technical indicators read across the market right now. Readings, rankings, presets and scan results are information. They are not financial, investment, tax or trading advice, and not a recommendation or solicitation to buy, sell or hold any digital asset.
Trading cryptocurrency carries substantial risk, including the risk of losing everything you put in. Market data shown in the app may be delayed, incomplete, interrupted or inaccurate; verify anything you act on against your own trusted source. You are solely responsible for your own trading decisions. Full detail is in the Terms of Use and the Privacy Policy.
Start screening today.
Pick an indicator, pick a condition, pick a timeframe. Every crypto pair that matches, ranked, in seconds.